3 Ways To Identify Customer Friction Using Your Adobe Analytics Data

Whether you’re new to Adobe Analytics or you’ve been using the tool for a number of years, there are always new ways of unlocking value from your Adobe Analytics data to identify opportunities where you can improve digital journeys for your customers or maximise commercial impact. As arguably the most powerful and flexible web analytics solution available on the market, Adobe Analytics gives you the power to dig deeper into your data, but it can often be difficult to know where to start when it comes to analysing data given the seemingly endless number of possibilities.
One key area we would all love to improve on our websites is reducing customer friction or struggle points, but how do we first identify friction so that we can then look at solving it? Friction comes in several different forms, from slow page load times to page errors or even how users navigate around your website. Some issues are much more visible and easier to identify, whilst some require a bit more thought on how best to quantify whether users are struggling with your journeys.
Below, we will explore three methods to simplify your analysis of customer friction and give you clear guidance on where you should be looking to implement improvements on your website.
All data referenced below is fictional and is used for demonstration purposes only
1. Use of Internal Search
Most websites have some form of internal search. The general purpose of this is to guide users to the content they are looking for in the event that they aren’t able to find what they want by navigating the site naturally. It is a useful tool for users, but it can also tell us a lot about how our users are interacting with the website.
A high percentage of users utilising the internal search function could indicate that your website’s navigation isn’t doing its job effectively. Your users may be struggling to find the content they are looking for, so they resort to using the internal search. If users are frustrated when browsing your website, they are more likely to abandon their browsing, resulting in poorer conversion rates.
To measure this in Adobe Analytics, you can create a simple Calculated Metric using your Search Results page, as shown below:
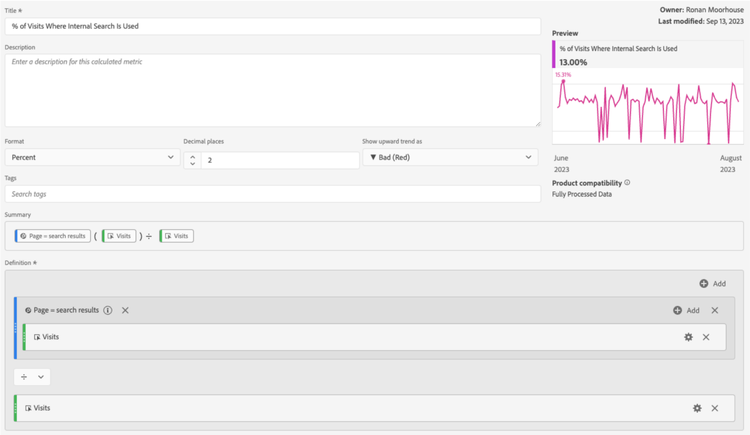
The Calculated Metric is defined by dividing the number of visits where the Search Results page was visited by the total number of visits to your website. It is important to ensure you set the format as ‘Percent’, whilst you can also adjust the decimal places to suit your preference. Finally, setting ‘Show upward trend as Bad (Red)’ in this instance makes the most sense given a higher percentage indicates customer friction.
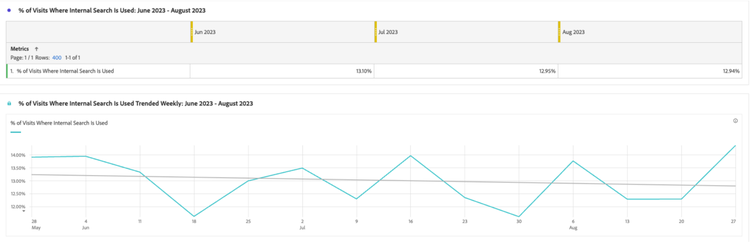
Once you have created the metric, you can trend the values in either a tabular or linear format to monitor how changes you make to your navigation, or website in general, impact internal search usage.
2. Null Search Results
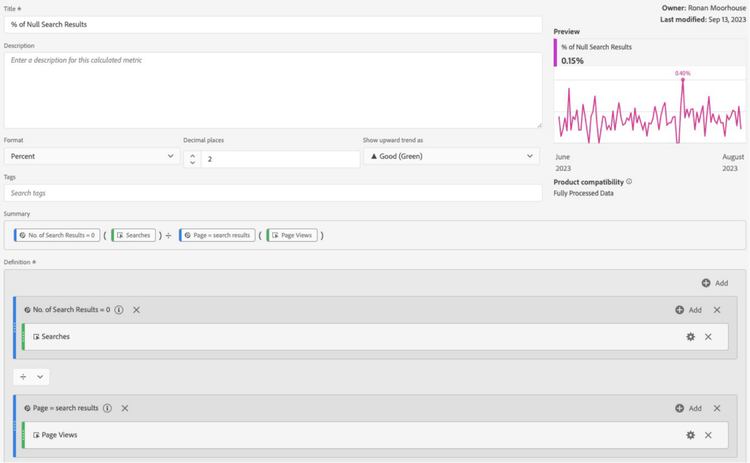
Another useful metric you can monitor for internal search is the percentage of null search results. This can indicate struggle when users are not being presented with the results they are looking for and may cause them to leave your website.
Depending on your exact implementation, this can be achieved by dividing the number of searches where zero search results are shown by the total number of searches (or page views of the search results page in our case):
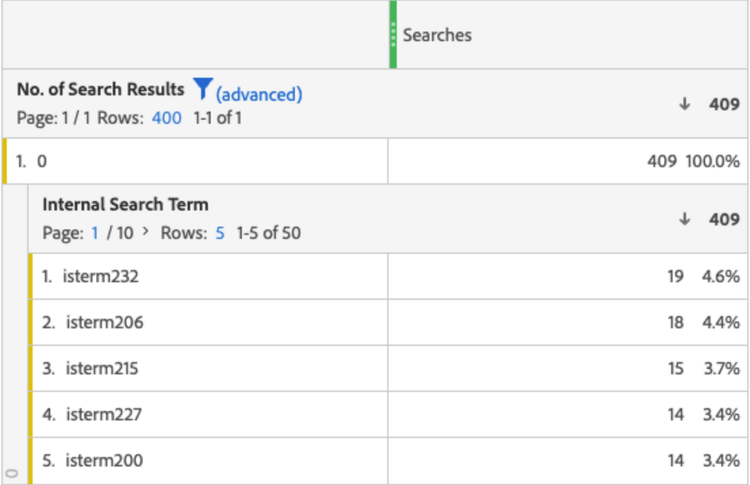
Providing you have implemented detailed tracking of your internal search results, you can use Adobe Analytics’ breakdown functionality to your advantage. The table below shows a view of searches where the number of search results was zero, broken down by the internal search team. This allows us to see the search terms that were used when the user was presented with no results. Based on these search terms, you can evaluate if there are gaps in your internal search function or if additional page tagging is required.
3. Page and Form Errors
The final topic we want to explore is the errors your users experience when interacting with your website. Whether these be 404-page load errors or errors with form fields, they can often be the most frustrating scenarios for users and are likely to result in customers abandoning journeys. Having robust error tracking implemented in your Adobe Analytics is crucial to highlighting these pain points.
Similar to the metrics we have discussed previously, creating a ‘Percentage of 404 Errors metric’ by dividing 404 error page views by total page views and trending these will allow you to track and identify any spikes in these errors.
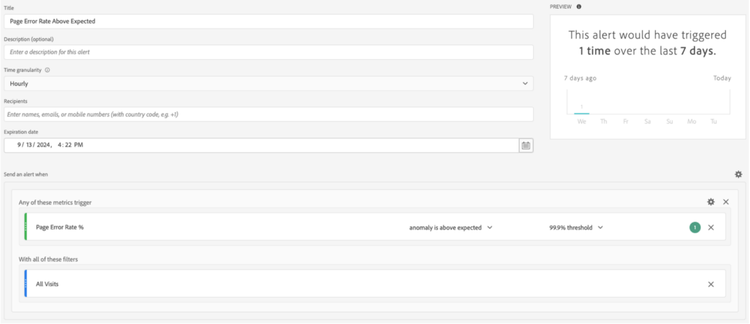
By combining this metric with Adobe Analytics’ alerts function, you can trigger alerts to be sent to key stakeholders if error rates spike higher than expected. The Adobe Sensei AI will identify anomalies above the expected value and send a notification to your recipients when the alert has been activated so that you can review and resolve any issues as soon as they happen.
We hope you can benefit from some of these methods in your future analysis, utilising them as a starting point to try and identify the friction points of your customers. We will continue sharing some of our favourite Adobe Analytics tips and tricks, so make sure to check back regularly.
If you are looking to take your Adobe Analytics implementation to the next level or if you are looking for support with understanding your customers and how your digital journeys are performing, please get in touch with us to discuss how we can help!
Foto von Sandeep Singh auf Unsplash